Category Archives: Freedomotic

Freedomotic logging for development and debugging Part 2

Ok, so now we have all our log messages coded in, with appropriate log levels like warn, info, debug. How do we control where they are sent, and how much we want to see?

Freedomotic  uses log4j to handle its logging output and the config file is at framework/freedomotic-core/src/main/resources/log4j.properties

The default at the moment is to log to the console but I want to log some to the console, and some to syslog. While I am developing, the console should show me important errors from all parts of the application and the output to syslog should show me the most granular output of the module I am working on, but also what was sent to the console. This allows me to see any important errors to do with my interactions with other parts of the application straight away on the console where I started the application, but also to see them in-line with my more detailed errors/debugging log via syslog.

Here is my log4j config:

# root logger
log4j.rootLogger=WARN, sysout, SYSLOG

# Output to console
log4j.appender.sysout=org.apache.log4j.ConsoleAppender
log4j.appender.sysout.threshold=WARN
log4j.appender.sysout.layout=org.apache.log4j.PatternLayout
log4j.appender.sysout.layout.ConversionPattern=%-5p <%t> [%C{1}]: %m%n

# Output to Syslog
log4j.appender.SYSLOG=org.apache.log4j.net.SyslogAppender
log4j.appender.SYSLOG.threshold=DEBUG
log4j.appender.SYSLOG.syslogHost=localhost
log4j.appender.SYSLOG.facility=local1
log4j.appender.SYSLOG.facilityPrinting=false
log4j.appender.SYSLOG.layout=org.apache.log4j.PatternLayout
log4j.appender.SYSLOG.layout.conversionPattern=%p <%t> [%C]: %m%n

# Detailed logging of my plugin
log4j.logger.com.freedomotic.plugins.devices.emoncms=DEBUG, SYSLOG
log4j.additivity.com.freedomotic.plugins.devices.emoncms=false
  • Root logger defines all the places I want to log to, and what starting level to send there. I have it set to WARN which means sysout and SYSLOG will get all messages of levels Warning or Error (since I am not expecting levels Critical, Alert or Emergency from my application – they are for the operating system).
  • The Console Appender is defined with a maximum level of WARN. This means that if I were to alter the root logger to DEBUG, I would still only get WARN and worse to it.
  • The Syslog Appender is defines with a maximum level of DEBUG, which means any log entry can potentially get there.
  • I am sending to the syslog facility ‘local1’ on localhost which I have configured in my syslog config to go to its own file (for tidyness).
  • My conversionPattern of ‘%p <%t> [%C]: %m%n’ is slightly different to what I have seen everywhere else on the internet (clue – it has a colon) and is specifically to stop a formatting error which messes up some entries when syslogging on my Mac. (I was getting spurious ‘Unknown’ and some truncation.)
  • The ‘log4j.additivity.com.freedomotic.emoncms=false’ line basically means don’t double-up messages – only add them if they aren’t already there.

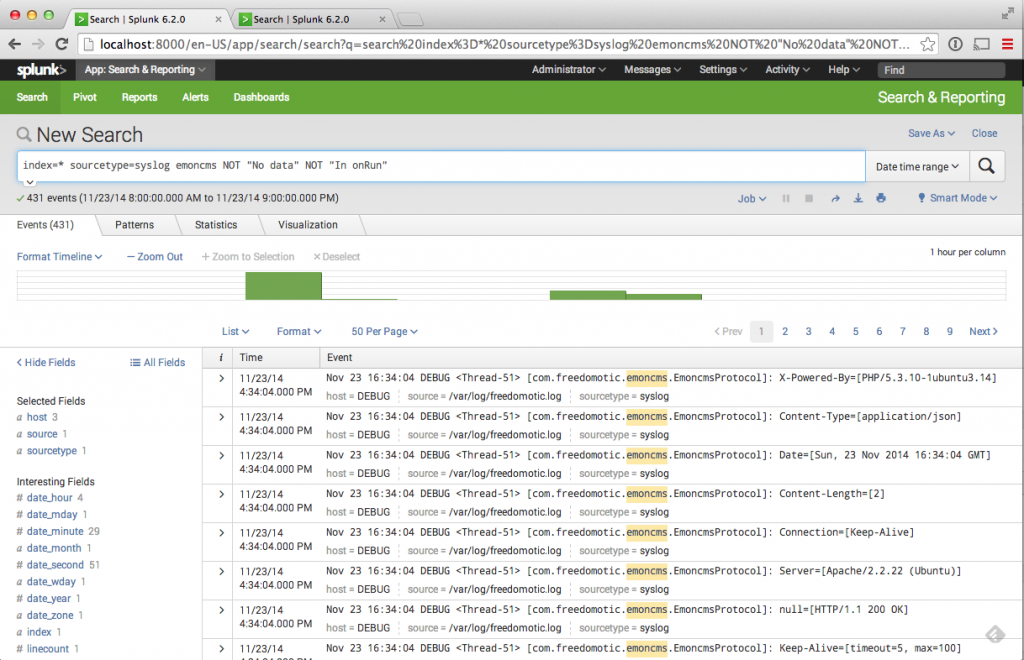
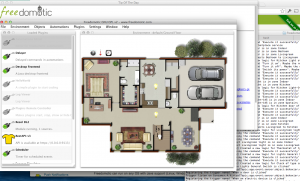
So, now I can debug by tailing my log, or better still I can deal with more awkward problems with my favourite log tool, Splunk:

Splunk log analysis

Freedomotic logging for development and debugging

Debug log
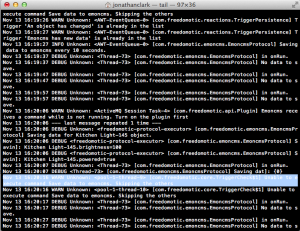
Out of the box, Freedomotic logging output currently goes to the console. When you start the application, you see a whole load of messages streaming past you on the screen – very messy.

For me, the logging output should go to a file or what I mean really is that it should be sent to syslog. Ultimately, this is the best way to log applications because putting it into a system designed just for logging means you get access to all the things build specifically for dealing with logging. That probably makes no sense, but I will try to explain by way of my setup.

But firstly, lets look at how the logging happens in Freedomotic. Here is an example of some code from my Resol DL2 plugin:

 LOG.info("Loading Resol DL2 devices..");

..and its easy to see this creates the output of my informative text to the log. Actually I am telling the plugin something else – I have set the log level of ‘info’ which is important too. When you write to the log, you always specify what level you want. Here are the log levels, and Apple’s suggested usage:

  • Emergency (level 0) – The highest priority, usually reserved for catastrophic failures and reboot notices.
  • Alert (level 1) – A serious failure in a key system.
  • Critical (level 2) – A failure in a key system.
  • Error (level 3) – Something has failed.
  • Warning (level 4) Something is amiss and might fail if not corrected.
  • Notice (level 5) – Things of moderate interest to the user or administrator.
  • Info (level 6) – The lowest priority that you would normally log, and purely informational in nature.
  • Debug (level 7) – The lowest priority, and normally not logged except for messages from the kernel.

So, in my case the message is ‘purely informational in nature’ – which it is. But why would I want to log this information? Won’t I be filling the log with pointless chatter?

Now, here is the good bit with proper logging inside an application. I can code in whatever log information at whatever level and then at runtime I can decide what logs I want output from the application.  This means I can put debugging log entries in the code and have these enabled for debugging, but turned off when I am not interested in seeing them.

Next lets see how how this is done..

Freedomotic plugin – Resol DL2 reader

The Resol DL2 is a data-logger and web interface for the Resol range of solar controllers, plus some other (similar) stuff they do. The controllers use a proprietary serial bus for communication called VBus, and the DL2 is a way of getting remote access to the information the controller (or group of controllers) connected to it, plus storing this data to an SD card which you can remove or download from.

Resol DL2

There is also an iOS app called VBus Touch which connects to it to give you the current status of the system, plus some short historic data:

Resol VBus Touch screen 1

Resol VBus Touch historic data


This is ok, but there are several things I would like to do:

1. Collect more historic data which can be viewed in graph form real-time.

2. Make decisions based on the water temperature at particular times of the day. For example, turn on the heating to top up the tank with hot water, but only on a cold day when I know there is no sun coming.

I figure that by collecting this data into Freedomotic I can achieve this at some point. But first it has to be collected..

Now, the DL2 has a page which displays real-time data from the controller:

Resol DL2 data

..which is updated from a URL which returns JSON: /dl2/download/download?source=current&output_type=json

As you can see from the image, the version I am running is 2.03. Resol have a later version which connects to their cloud system but I would have to pay for the upgrade. I asked them if the JSON is still there, but they told me I should use the daily data download function (which obviously won’t give me real-time data).

Here is what the output looks like:

{
  "min_time" : 1406906963,
  "max_time" : 1406906963,
  "sieve_interval" : 1,
  "headerset_count" : 1,
  "unique_header_count" : 1,
  "headers" : [
  {
    "id" : "0010_4278_0100",
    "extId" : "00_0010_4278_0100",
    "channel" : 0,
    "destination_address" : 16,
    "source_address" : 17016,
    "protocol_version" : 16,
    "command" : 256,
    "length" : 28,
    "info" : 0,
    "destination_name" : "DFA",
    "source_name" : "DeltaSol BS/DrainBack",
    "fields" : [
    {
      "id" : "000_2_0",
      "name" : "Temperature sensor 1",
      "unit" : " °C"
    },
    {
      "id" : "002_2_0",
      "name" : "Temperature sensor 2",
      "unit" : " °C"
    },
    {
      "id" : "004_2_0",
      "name" : "Temperature sensor 3",
      "unit" : " °C"
    },
    {
      "id" : "006_2_0",
      "name" : "Temperature sensor 4",
      "unit" : " °C"
    },
    {
      "id" : "008_1_0",
      "name" : "Pump speed relay 1",
      "unit" : " %"
    },
    {
      "id" : "009_1_0",
      "name" : "Pump speed relay 2",
      "unit" : " %"
    },
    {
      "id" : "010_1_1",
      "name" : "Sensor 1 defective",
      "unit" : ""
    },
    {
      "id" : "010_1_2",
      "name" : "Sensor 2 defective",
      "unit" : ""
    },
    {
      "id" : "010_1_4",
      "name" : "Sensor 3 defective",
      "unit" : ""
    },
    {
      "id" : "010_1_8",
      "name" : "Sensor 4 defective",
      "unit" : ""
    },
    {
      "id" : "010_1_16",
      "name" : "Emergency store temperature",
      "unit" : ""
    },
    {
      "id" : "010_1_32",
      "name" : "Collector emergency temperature",
      "unit" : ""
    },
    {
      "id" : "011_1_1",
      "name" : "R1 manual operation",
      "unit" : ""
    },
    {
      "id" : "011_1_2",
      "name" : "R2 manual operation",
      "unit" : ""
    },
    {
      "id" : "012_2_0",
      "name" : "Operating hours relay 1",
      "unit" : " h"
    },
    {
      "id" : "014_2_0",
      "name" : "Operating hours relay 2",
      "unit" : " h"
    },
    {
      "id" : "016_2_0",
      "name" : "Heat quantity",
      "unit" : " Wh"
    },
    {
      "id" : "022_1_0",
      "name" : "Status",
      "unit" : ""
    },
    {
      "id" : "023_1_0",
      "name" : "Programme",
      "unit" : ""
    },
    {
      "id" : "024_2_0",
      "name" : "Version",
      "unit" : ""
    }
    ]
  }
  ],
  "headersets" : [
  {
    "timestamp" : 1406906963,
    "packets" : [
    {
      "header_index" : 0,
      "field_values" : [
      {
        "field_index" : 0,
        "raw_value" : 108.100000,
        "value" : "108.1"
      },
      {
        "field_index" : 1,
        "raw_value" : 61.300000,
        "value" : "61.3"
      },
      {
        "field_index" : 2,
        "raw_value" : 65.600000,
        "value" : "65.6"
      },
      {
        "field_index" : 3,
        "raw_value" : 888.800000,
        "value" : "888.8"
      },
      {
        "field_index" : 4,
        "raw_value" : 0,
        "value" : "0"
      },
      {
        "field_index" : 5,
        "raw_value" : 0,
        "value" : "0"
      },
      {
        "field_index" : 6,
        "raw_value" : 0,
        "value" : "0"
      },
      {
        "field_index" : 7,
        "raw_value" : 0,
        "value" : "0"
      },
      {
        "field_index" : 8,
        "raw_value" : 0,
        "value" : "0"
      },
      {
        "field_index" : 9,
        "raw_value" : 0,
        "value" : "0"
      },
      {
        "field_index" : 10,
        "raw_value" : 0,
        "value" : "0"
      },
      {
        "field_index" : 11,
        "raw_value" : 0,
        "value" : "0"
      },
      {
        "field_index" : 12,
        "raw_value" : 0,
        "value" : "0"
      },
      {
        "field_index" : 13,
        "raw_value" : 0,
        "value" : "0"
      },
      {
        "field_index" : 14,
        "raw_value" : 6883.000000,
        "value" : "6883"
      },
      {
        "field_index" : 15,
        "raw_value" : 0,
        "value" : "0"
      },
      {
        "field_index" : 16,
        "raw_value" : 0,
        "value" : "0"
      },
      {
        "field_index" : 17,
        "raw_value" : 1.000000,
        "value" : "1"
      },
      {
        "field_index" : 18,
        "raw_value" : 3.000000,
        "value" : "3"
      },
      {
        "field_index" : 19,
        "raw_value" : 2.030000,
        "value" : "2.03"
      }
      ],
      "data" : [
        57,
        4,
        101,
        2,
        144,
        2,
        184,
        34,
        0,
        0,
        0,
        0,
        227,
        26,
        0,
        0,
        0,
        0,
        0,
        0,
        0,
        0,
        1,
        3,
        203,
        0,
        0,
        0
      ]
    }
    ]
  }
  ]
}

So, I can take this output to collect the info I need into Freedomotic using a custom plugin, and publish it on the event bus to make use of. I decided to make the module flexible enough to collect data from as many devices as there are connected to the DL2, but also so you could specify which info you wanted. You can set this up in the manifest.xml config file.

The module is in Github: https://github.com/cllarky/freedomotic/tree/resol_plugin

resol_data

Next step is to work out how to log and graph the data..


Freedomotic Framework

Freedomotic is described as a ‘Smart Spaces Framework’ and is designed to be the glue to connect together all the elements of your building automation and be the decision engine to control what happens. IFreedomotict is extensible and so any new sensor/actuator/thing you can connect to can be made to work with it. For example it could connect to your Google Calendar to see when you are on holiday, and turn down the heating, or tweet you when the cat comes home.

It is written in Java and can run on Windows, Linux, Mac or anything with a Java environment. Better still, it is open source and has a community of developers supporting and nurturing its growth. Freedomotic is up and running in the Setfire Labs and so we will be hacking about with some plugins and seeing what fun we can have with it.