Monthly Archives: August 2014

Using emoncms for eco-eye data

emoncms is the data storage, graphing and general visualisations for the OpenEnergyMonitoring project.

For some time here at the Labs we have been using Xively for the data collection and graphing of our energy usage and other sensor stuff. It has really good graphing, plus excellent debug console for checking the incoming data. Beyond this, we have not really been making the best use of it.

We have now switched to emoncms for data collection and graphing. This will give us a better ability to graph multiple feeds together and in any case we will be moving to their sensors at some point in the future.

Their system is open source, so we could choose to host/run our own data collection/storage/graphing but for now an account with them will do. At a later date we can choose to migrate by downloading all our data from them.

After creating an account at emoncms  we set about sending them some data. This is described here and the Perl script we used to connect to Xively has been altered to post to emoncms with JSON type data as described on their API input page. It looks like this:

http://emoncms.org/input/post.json?json={power:200}&apikey=xxxxxxxxxxxxxxxxx

Power is in Watts, but you can pass anything to them in this way, including multiple inputs like {power1:123,power2:456}. For graphing with Xively we separately sent current and (calculated) power, but with emoncms there is no point because any ‘visualisation’ – graph / readout / dial – can be scaled and so if we send power consumption, we can back-calculate to current. This means we are not doubling up the collected data.

Once we started posting data to our account, the feed was listed in the feeds page:

emoncms feeds

..where we could tell it to log the data, and then we could get a graph of the data from the visualisations page:

emoncms graph


Better still, we could make a dashboard:

emoncms dashboard

Dashboards can be made public and so you can publish them if you want (as can individual feeds). Great stuff!

Perl script for eco-eye serial to emoncms is here on Github.


Eco-Eye energy monitor serial data collection

A few years ago my minions installed an Eco-Eye energy monitor in the Labs. We bought it with a serial cable and it has been connected to a Mac Mini to collect data and push it to Cosm (now Xively) via a Perl script. The serial output is 19,200 baud, 8-none-1.Eco-Eye

The supplied serial cable uses a Prolific PL2303 USB to serial chip and so the Mac needs a driver installing which you can get from Prolific here. The current version creates a device named /dev/tty.usbserial (which is much better than the previous cryptic name).

The Eco-Eye data is simple – two bytes which make up the reading are sent every four seconds consisting of msb then lsb representing amps times 100. So, the reading in amps to two decimal places is:

amps = ((byte1 x 256) + byte2) / 100

There is a Perl module to handle posting to Xively called Net::Parchube (because Xively was Cosm was Parchube) which makes that part simple. The hardest part is keeping the bytes in sync – when you start the script you don’t know which one you get first, and sometimes one doesn’t turn up. To handle this, the script has a timeout which makes sure dud readings don’t make it through and corrupt your data. It also averages over seven samples to post a reading about every 30 seconds.

Output will look something like this:

sample: 1, msb: 11, lsb; 18, amps: 28.34
sample: 2, msb: 11, lsb; 36, amps: 28.52
sample: 3, msb: 10, lsb; 244, amps: 28.04
sample: 4, msb: 11, lsb; 24, amps: 28.4
sample: 5, msb: 11, lsb; 28, amps: 28.44
sample: 6, msb: 11, lsb; 8, amps: 28.24
sample: 7, msb: 10, lsb; 240, amps: 28
2014-08-12 10:15:18 avg_amps: 28.28

And on Xively:

xively_data

As you can see, the script also sends a power figure calculated from the amps.

The script runs in the foreground which is not ideal, but it does the job. You can get it from Github here: https://github.com/cllarky/perl-sensor-net/blob/master/eco-eye/serial-cosm.pl

Freedomotic plugin – Resol DL2 reader

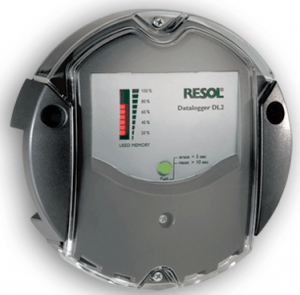
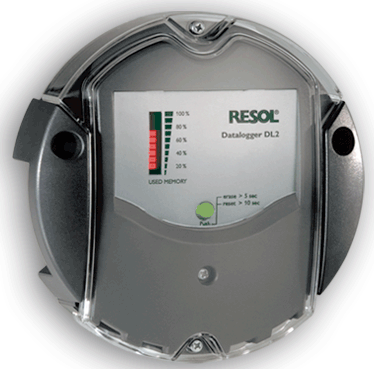
The Resol DL2 is a data-logger and web interface for the Resol range of solar controllers, plus some other (similar) stuff they do. The controllers use a proprietary serial bus for communication called VBus, and the DL2 is a way of getting remote access to the information the controller (or group of controllers) connected to it, plus storing this data to an SD card which you can remove or download from.

Resol DL2

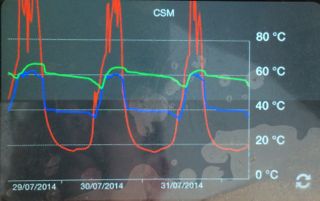
There is also an iOS app called VBus Touch which connects to it to give you the current status of the system, plus some short historic data:

Resol VBus Touch screen 1

Resol VBus Touch historic data


This is ok, but there are several things I would like to do:

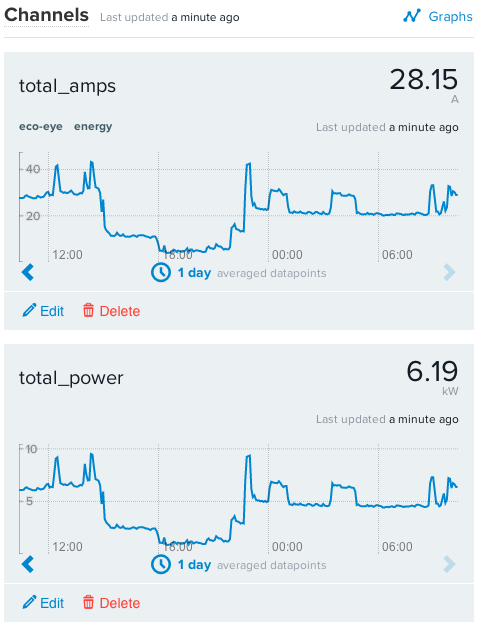
1. Collect more historic data which can be viewed in graph form real-time.

2. Make decisions based on the water temperature at particular times of the day. For example, turn on the heating to top up the tank with hot water, but only on a cold day when I know there is no sun coming.

I figure that by collecting this data into Freedomotic I can achieve this at some point. But first it has to be collected..

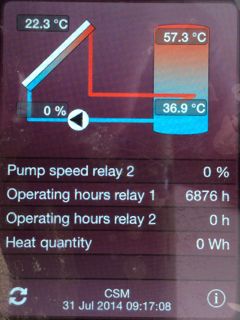
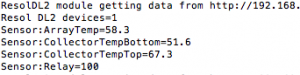
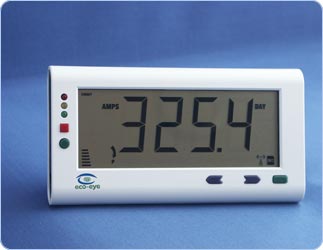
Now, the DL2 has a page which displays real-time data from the controller:

Resol DL2 data

..which is updated from a URL which returns JSON: /dl2/download/download?source=current&output_type=json

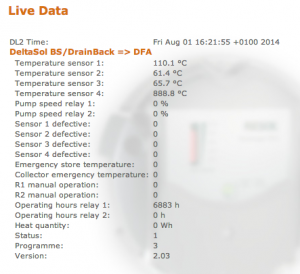
As you can see from the image, the version I am running is 2.03. Resol have a later version which connects to their cloud system but I would have to pay for the upgrade. I asked them if the JSON is still there, but they told me I should use the daily data download function (which obviously won’t give me real-time data).

Here is what the output looks like:

{
  "min_time" : 1406906963,
  "max_time" : 1406906963,
  "sieve_interval" : 1,
  "headerset_count" : 1,
  "unique_header_count" : 1,
  "headers" : [
  {
    "id" : "0010_4278_0100",
    "extId" : "00_0010_4278_0100",
    "channel" : 0,
    "destination_address" : 16,
    "source_address" : 17016,
    "protocol_version" : 16,
    "command" : 256,
    "length" : 28,
    "info" : 0,
    "destination_name" : "DFA",
    "source_name" : "DeltaSol BS/DrainBack",
    "fields" : [
    {
      "id" : "000_2_0",
      "name" : "Temperature sensor 1",
      "unit" : " °C"
    },
    {
      "id" : "002_2_0",
      "name" : "Temperature sensor 2",
      "unit" : " °C"
    },
    {
      "id" : "004_2_0",
      "name" : "Temperature sensor 3",
      "unit" : " °C"
    },
    {
      "id" : "006_2_0",
      "name" : "Temperature sensor 4",
      "unit" : " °C"
    },
    {
      "id" : "008_1_0",
      "name" : "Pump speed relay 1",
      "unit" : " %"
    },
    {
      "id" : "009_1_0",
      "name" : "Pump speed relay 2",
      "unit" : " %"
    },
    {
      "id" : "010_1_1",
      "name" : "Sensor 1 defective",
      "unit" : ""
    },
    {
      "id" : "010_1_2",
      "name" : "Sensor 2 defective",
      "unit" : ""
    },
    {
      "id" : "010_1_4",
      "name" : "Sensor 3 defective",
      "unit" : ""
    },
    {
      "id" : "010_1_8",
      "name" : "Sensor 4 defective",
      "unit" : ""
    },
    {
      "id" : "010_1_16",
      "name" : "Emergency store temperature",
      "unit" : ""
    },
    {
      "id" : "010_1_32",
      "name" : "Collector emergency temperature",
      "unit" : ""
    },
    {
      "id" : "011_1_1",
      "name" : "R1 manual operation",
      "unit" : ""
    },
    {
      "id" : "011_1_2",
      "name" : "R2 manual operation",
      "unit" : ""
    },
    {
      "id" : "012_2_0",
      "name" : "Operating hours relay 1",
      "unit" : " h"
    },
    {
      "id" : "014_2_0",
      "name" : "Operating hours relay 2",
      "unit" : " h"
    },
    {
      "id" : "016_2_0",
      "name" : "Heat quantity",
      "unit" : " Wh"
    },
    {
      "id" : "022_1_0",
      "name" : "Status",
      "unit" : ""
    },
    {
      "id" : "023_1_0",
      "name" : "Programme",
      "unit" : ""
    },
    {
      "id" : "024_2_0",
      "name" : "Version",
      "unit" : ""
    }
    ]
  }
  ],
  "headersets" : [
  {
    "timestamp" : 1406906963,
    "packets" : [
    {
      "header_index" : 0,
      "field_values" : [
      {
        "field_index" : 0,
        "raw_value" : 108.100000,
        "value" : "108.1"
      },
      {
        "field_index" : 1,
        "raw_value" : 61.300000,
        "value" : "61.3"
      },
      {
        "field_index" : 2,
        "raw_value" : 65.600000,
        "value" : "65.6"
      },
      {
        "field_index" : 3,
        "raw_value" : 888.800000,
        "value" : "888.8"
      },
      {
        "field_index" : 4,
        "raw_value" : 0,
        "value" : "0"
      },
      {
        "field_index" : 5,
        "raw_value" : 0,
        "value" : "0"
      },
      {
        "field_index" : 6,
        "raw_value" : 0,
        "value" : "0"
      },
      {
        "field_index" : 7,
        "raw_value" : 0,
        "value" : "0"
      },
      {
        "field_index" : 8,
        "raw_value" : 0,
        "value" : "0"
      },
      {
        "field_index" : 9,
        "raw_value" : 0,
        "value" : "0"
      },
      {
        "field_index" : 10,
        "raw_value" : 0,
        "value" : "0"
      },
      {
        "field_index" : 11,
        "raw_value" : 0,
        "value" : "0"
      },
      {
        "field_index" : 12,
        "raw_value" : 0,
        "value" : "0"
      },
      {
        "field_index" : 13,
        "raw_value" : 0,
        "value" : "0"
      },
      {
        "field_index" : 14,
        "raw_value" : 6883.000000,
        "value" : "6883"
      },
      {
        "field_index" : 15,
        "raw_value" : 0,
        "value" : "0"
      },
      {
        "field_index" : 16,
        "raw_value" : 0,
        "value" : "0"
      },
      {
        "field_index" : 17,
        "raw_value" : 1.000000,
        "value" : "1"
      },
      {
        "field_index" : 18,
        "raw_value" : 3.000000,
        "value" : "3"
      },
      {
        "field_index" : 19,
        "raw_value" : 2.030000,
        "value" : "2.03"
      }
      ],
      "data" : [
        57,
        4,
        101,
        2,
        144,
        2,
        184,
        34,
        0,
        0,
        0,
        0,
        227,
        26,
        0,
        0,
        0,
        0,
        0,
        0,
        0,
        0,
        1,
        3,
        203,
        0,
        0,
        0
      ]
    }
    ]
  }
  ]
}

So, I can take this output to collect the info I need into Freedomotic using a custom plugin, and publish it on the event bus to make use of. I decided to make the module flexible enough to collect data from as many devices as there are connected to the DL2, but also so you could specify which info you wanted. You can set this up in the manifest.xml config file.

The module is in Github: https://github.com/cllarky/freedomotic/tree/resol_plugin

resol_data

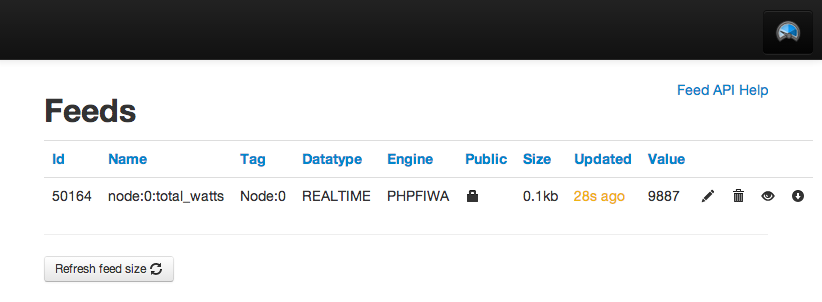
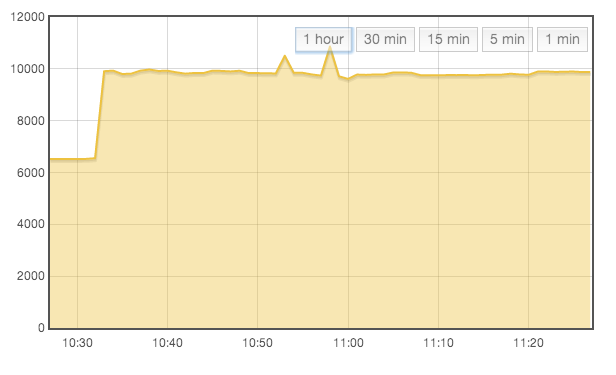
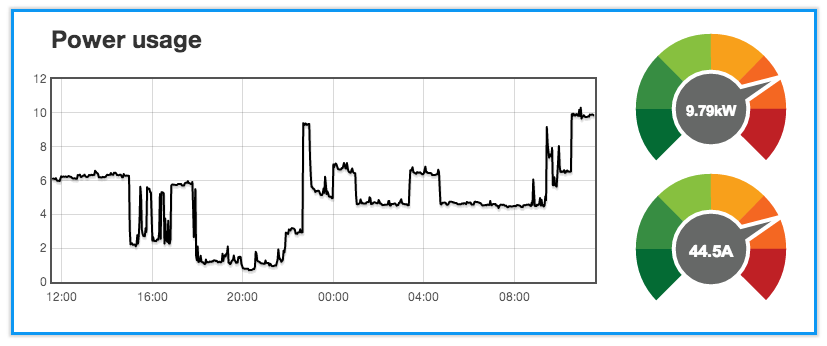
Next step is to work out how to log and graph the data..


Freedomotic Framework

Freedomotic is described as a ‘Smart Spaces Framework’ and is designed to be the glue to connect together all the elements of your building automation and be the decision engine to control what happens. IFreedomotic
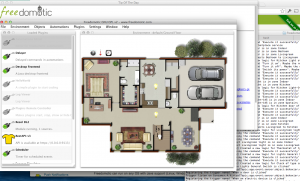
t is extensible and so any new sensor/actuator/thing you can connect to can be made to work with it. For example it could connect to your Google Calendar to see when you are on holiday, and turn down the heating, or tweet you when the cat comes home.

It is written in Java and can run on Windows, Linux, Mac or anything with a Java environment. Better still, it is open source and has a community of developers supporting and nurturing its growth. Freedomotic is up and running in the Setfire Labs and so we will be hacking about with some plugins and seeing what fun we can have with it.

Somewhere between Arduino and Crestron

So what should a building automation system be like?

At one end, its a hobbyist/geek’s world. You build it, program it and install it. At the other, its a system installed (usually when your house/office/building is built) by a specialist company who then spend a huge amount of time setting it up, and then they return to it every time something needs reconfiguring.

glueWhat is there in the middle?

There are a large number of specialist systems utilising use of cheap micro-controllers which are designed to cover one specific task pretty much in isolation. Some of these systems even do a good job. Their designers then build their own web-enabled extensions so that you can install their app and visit their website to interact with their heating controller/aircon/solar controller/energy monitor/etc./etc.

Something is needed to glue all these different systems together or replace them. But most importantly, any system system must be able to be operated (and configured) by the user. If your partner/wife/mum can’t work it, it’s pointless.