emoncms is the data storage, graphing and general visualisations for the OpenEnergyMonitoring project.
For some time here at the Labs we have been using Xively for the data collection and graphing of our energy usage and other sensor stuff. It has really good graphing, plus excellent debug console for checking the incoming data. Beyond this, we have not really been making the best use of it.
We have now switched to emoncms for data collection and graphing. This will give us a better ability to graph multiple feeds together and in any case we will be moving to their sensors at some point in the future.
Their system is open source, so we could choose to host/run our own data collection/storage/graphing but for now an account with them will do. At a later date we can choose to migrate by downloading all our data from them.
After creating an account at emoncms we set about sending them some data. This is described here and the Perl script we used to connect to Xively has been altered to post to emoncms with JSON type data as described on their API input page. It looks like this:
http://emoncms.org/input/post.json?json={power:200}&apikey=xxxxxxxxxxxxxxxxx
Power is in Watts, but you can pass anything to them in this way, including multiple inputs like {power1:123,power2:456}. For graphing with Xively we separately sent current and (calculated) power, but with emoncms there is no point because any ‘visualisation’ – graph / readout / dial – can be scaled and so if we send power consumption, we can back-calculate to current. This means we are not doubling up the collected data.
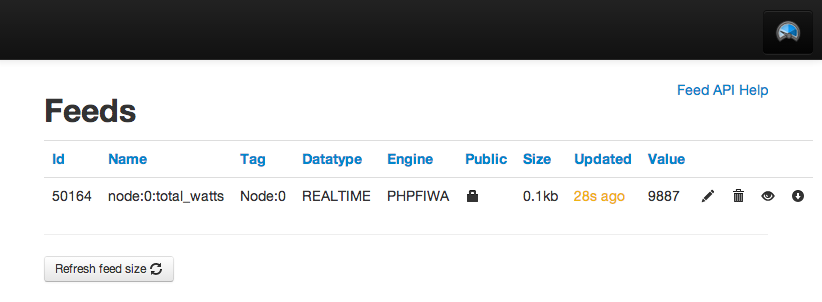
Once we started posting data to our account, the feed was listed in the feeds page:

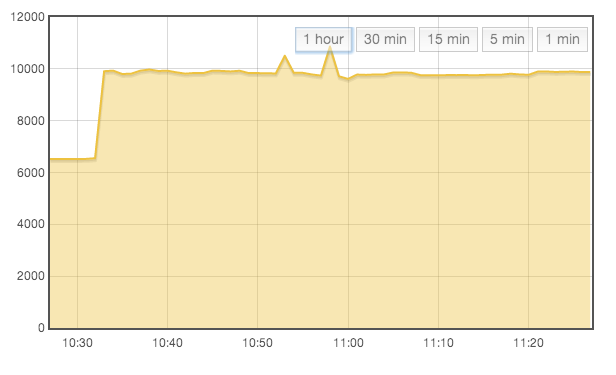
..where we could tell it to log the data, and then we could get a graph of the data from the visualisations page:

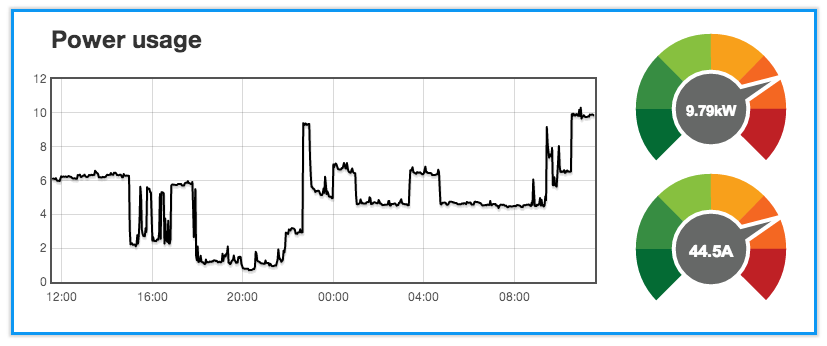
Better still, we could make a dashboard:

Dashboards can be made public and so you can publish them if you want (as can individual feeds). Great stuff!
Perl script for eco-eye serial to emoncms is here on Github.