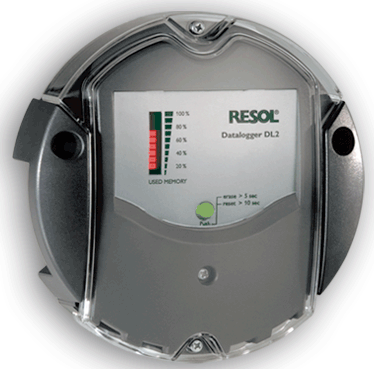
The Resol DL2 is a data-logger and web interface for the Resol range of solar controllers, plus some other (similar) stuff they do. The controllers use a proprietary serial bus for communication called VBus, and the DL2 is a way of getting remote access to the information the controller (or group of controllers) connected to it, plus storing this data to an SD card which you can remove or download from.
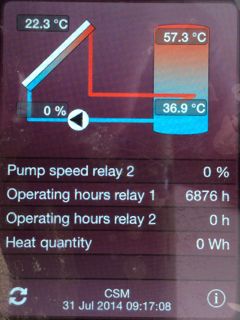
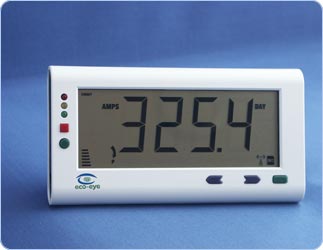
There is also an iOS app called VBus Touch which connects to it to give you the current status of the system, plus some short historic data:
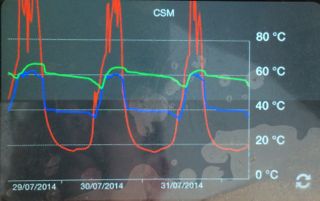
This is ok, but there are several things I would like to do:
1. Collect more historic data which can be viewed in graph form real-time.
2. Make decisions based on the water temperature at particular times of the day. For example, turn on the heating to top up the tank with hot water, but only on a cold day when I know there is no sun coming.
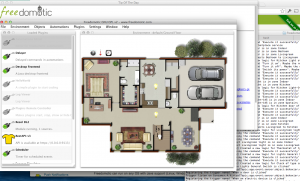
I figure that by collecting this data into Freedomotic I can achieve this at some point. But first it has to be collected..
Now, the DL2 has a page which displays real-time data from the controller:
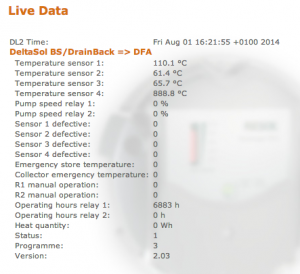
..which is updated from a URL which returns JSON: /dl2/download/download?source=current&output_type=json
As you can see from the image, the version I am running is 2.03. Resol have a later version which connects to their cloud system but I would have to pay for the upgrade. I asked them if the JSON is still there, but they told me I should use the daily data download function (which obviously won’t give me real-time data).
Here is what the output looks like:
{
  "min_time" : 1406906963,
  "max_time" : 1406906963,
  "sieve_interval" : 1,
  "headerset_count" : 1,
  "unique_header_count" : 1,
  "headers" : [
  {
    "id" : "0010_4278_0100",
    "extId" : "00_0010_4278_0100",
    "channel" : 0,
    "destination_address" : 16,
    "source_address" : 17016,
    "protocol_version" : 16,
    "command" : 256,
    "length" : 28,
    "info" : 0,
    "destination_name" : "DFA",
    "source_name" : "DeltaSol BS/DrainBack",
    "fields" : [
    {
      "id" : "000_2_0",
      "name" : "Temperature sensor 1",
      "unit" : " °C"
    },
    {
      "id" : "002_2_0",
      "name" : "Temperature sensor 2",
      "unit" : " °C"
    },
    {
      "id" : "004_2_0",
      "name" : "Temperature sensor 3",
      "unit" : " °C"
    },
    {
      "id" : "006_2_0",
      "name" : "Temperature sensor 4",
      "unit" : " °C"
    },
    {
      "id" : "008_1_0",
      "name" : "Pump speed relay 1",
      "unit" : " %"
    },
    {
      "id" : "009_1_0",
      "name" : "Pump speed relay 2",
      "unit" : " %"
    },
    {
      "id" : "010_1_1",
      "name" : "Sensor 1 defective",
      "unit" : ""
    },
    {
      "id" : "010_1_2",
      "name" : "Sensor 2 defective",
      "unit" : ""
    },
    {
      "id" : "010_1_4",
      "name" : "Sensor 3 defective",
      "unit" : ""
    },
    {
      "id" : "010_1_8",
      "name" : "Sensor 4 defective",
      "unit" : ""
    },
    {
      "id" : "010_1_16",
      "name" : "Emergency store temperature",
      "unit" : ""
    },
    {
      "id" : "010_1_32",
      "name" : "Collector emergency temperature",
      "unit" : ""
    },
    {
      "id" : "011_1_1",
      "name" : "R1 manual operation",
      "unit" : ""
    },
    {
      "id" : "011_1_2",
      "name" : "R2 manual operation",
      "unit" : ""
    },
    {
      "id" : "012_2_0",
      "name" : "Operating hours relay 1",
      "unit" : " h"
    },
    {
      "id" : "014_2_0",
      "name" : "Operating hours relay 2",
      "unit" : " h"
    },
    {
      "id" : "016_2_0",
      "name" : "Heat quantity",
      "unit" : " Wh"
    },
    {
      "id" : "022_1_0",
      "name" : "Status",
      "unit" : ""
    },
    {
      "id" : "023_1_0",
      "name" : "Programme",
      "unit" : ""
    },
    {
      "id" : "024_2_0",
      "name" : "Version",
      "unit" : ""
    }
    ]
  }
  ],
  "headersets" : [
  {
    "timestamp" : 1406906963,
    "packets" : [
    {
      "header_index" : 0,
      "field_values" : [
      {
        "field_index" : 0,
        "raw_value" : 108.100000,
        "value" : "108.1"
      },
      {
        "field_index" : 1,
        "raw_value" : 61.300000,
        "value" : "61.3"
      },
      {
        "field_index" : 2,
        "raw_value" : 65.600000,
        "value" : "65.6"
      },
      {
        "field_index" : 3,
        "raw_value" : 888.800000,
        "value" : "888.8"
      },
      {
        "field_index" : 4,
        "raw_value" : 0,
        "value" : "0"
      },
      {
        "field_index" : 5,
        "raw_value" : 0,
        "value" : "0"
      },
      {
        "field_index" : 6,
        "raw_value" : 0,
        "value" : "0"
      },
      {
        "field_index" : 7,
        "raw_value" : 0,
        "value" : "0"
      },
      {
        "field_index" : 8,
        "raw_value" : 0,
        "value" : "0"
      },
      {
        "field_index" : 9,
        "raw_value" : 0,
        "value" : "0"
      },
      {
        "field_index" : 10,
        "raw_value" : 0,
        "value" : "0"
      },
      {
        "field_index" : 11,
        "raw_value" : 0,
        "value" : "0"
      },
      {
        "field_index" : 12,
        "raw_value" : 0,
        "value" : "0"
      },
      {
        "field_index" : 13,
        "raw_value" : 0,
        "value" : "0"
      },
      {
        "field_index" : 14,
        "raw_value" : 6883.000000,
        "value" : "6883"
      },
      {
        "field_index" : 15,
        "raw_value" : 0,
        "value" : "0"
      },
      {
        "field_index" : 16,
        "raw_value" : 0,
        "value" : "0"
      },
      {
        "field_index" : 17,
        "raw_value" : 1.000000,
        "value" : "1"
      },
      {
        "field_index" : 18,
        "raw_value" : 3.000000,
        "value" : "3"
      },
      {
        "field_index" : 19,
        "raw_value" : 2.030000,
        "value" : "2.03"
      }
      ],
      "data" : [
        57,
        4,
        101,
        2,
        144,
        2,
        184,
        34,
        0,
        0,
        0,
        0,
        227,
        26,
        0,
        0,
        0,
        0,
        0,
        0,
        0,
        0,
        1,
        3,
        203,
        0,
        0,
        0
      ]
    }
    ]
  }
  ]
}
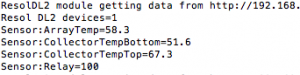
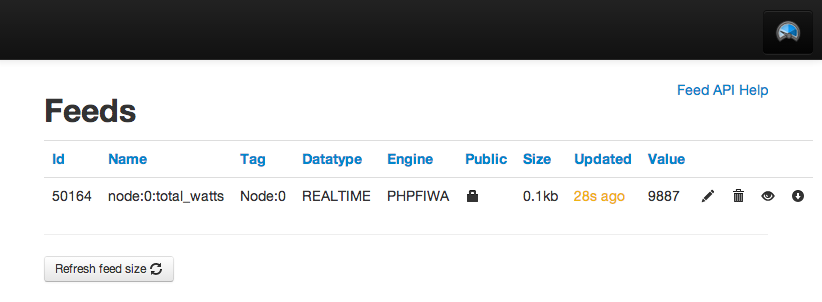
So, I can take this output to collect the info I need into Freedomotic using a custom plugin, and publish it on the event bus to make use of. I decided to make the module flexible enough to collect data from as many devices as there are connected to the DL2, but also so you could specify which info you wanted. You can set this up in the manifest.xml config file.
The module is in Github: https://github.com/cllarky/freedomotic/tree/resol_plugin
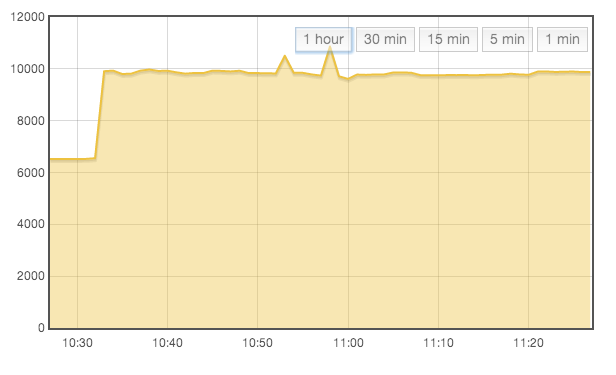
Next step is to work out how to log and graph the data..
 If you don’t want to read on, the short answer is ‘no’.
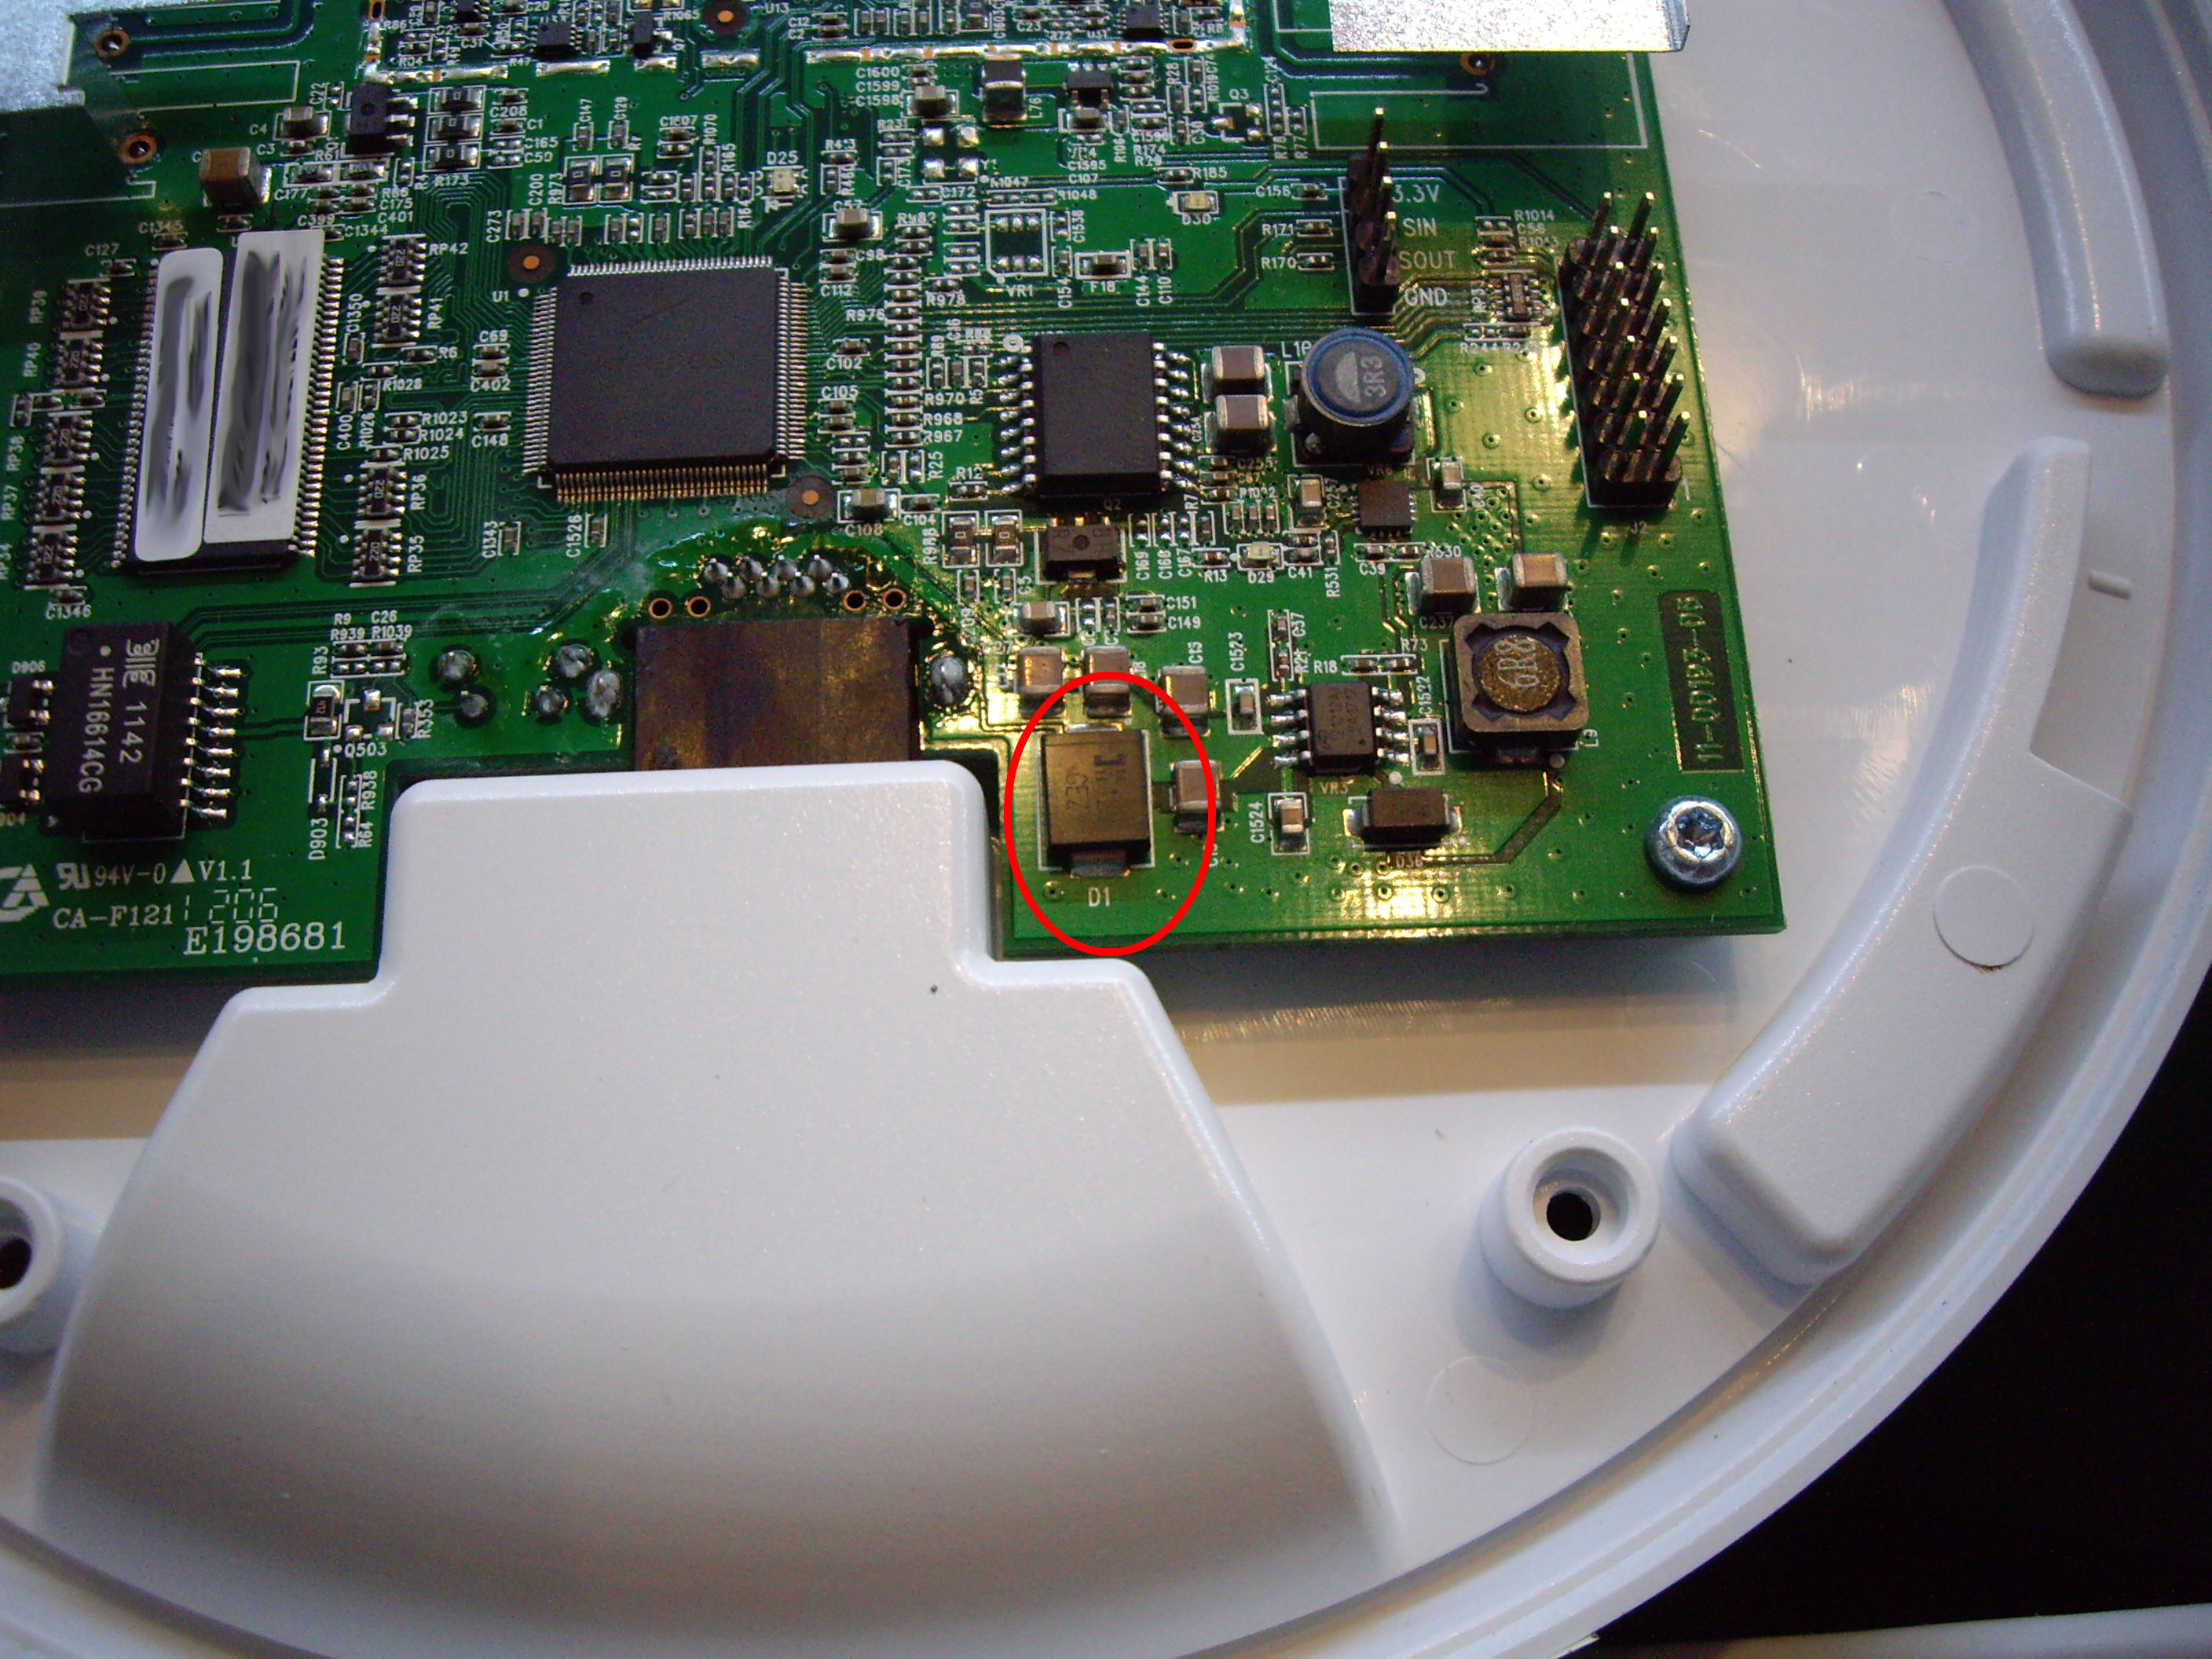
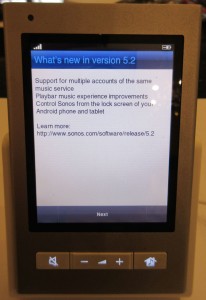 Back to the ‘dead spot’ fault. This is where areas of the controller stop responding to touch in some areas. It mostly seems to affect the lower areas of the screen, making it impossible to view the playlist, use the back button etc. When it affects the bottom row, it is impossible to upgrade your controller as it needs you to press ‘Next’ to continue. This renders the controller useless. (If only they had a way of reducing the screen display area to move the buttons, or flipping the screen when you turned the controller upside down.)
 Disassembly starts with the battery cover and battery. There are two screws which hold the rear cover in place. One has a tamper-proof label over it so Sonos can see if you have been meddling with it.
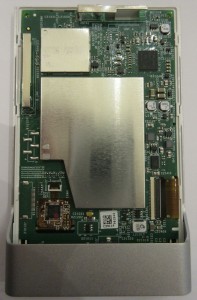 Here is what it looks like inside. There are two membrane cables with zero-insertion-force connectors. The longer one on the bottom right is for the screen, and the one at the bottom left is for the touch.
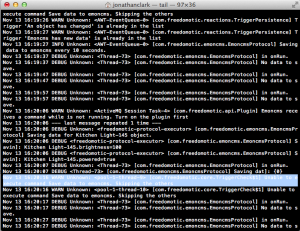
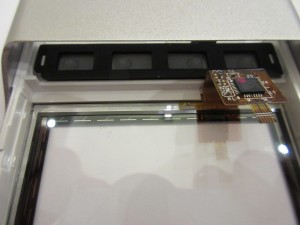 Once the circuit board is removed, you have the screen, which now be lifted out. You can now see the touch screen circuit around the edge of the glass and the connections from the glass to the membrane wiring and controller chip.
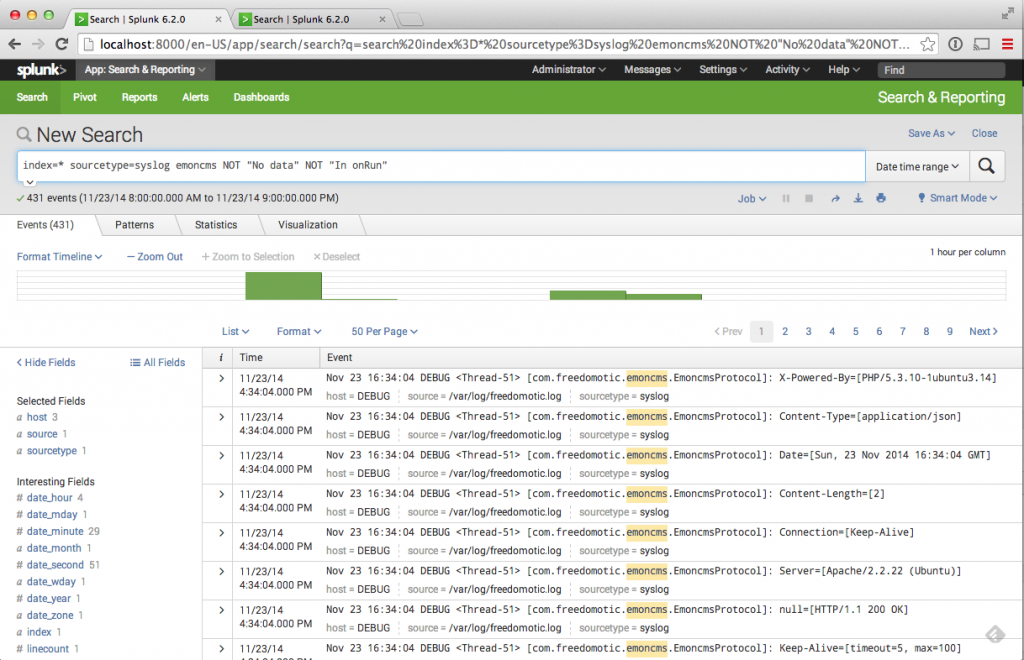
 Out of the box, Freedomotic logging output currently goes to the console. When you start the application, you see a whole load of messages streaming past you on the screen – very messy.
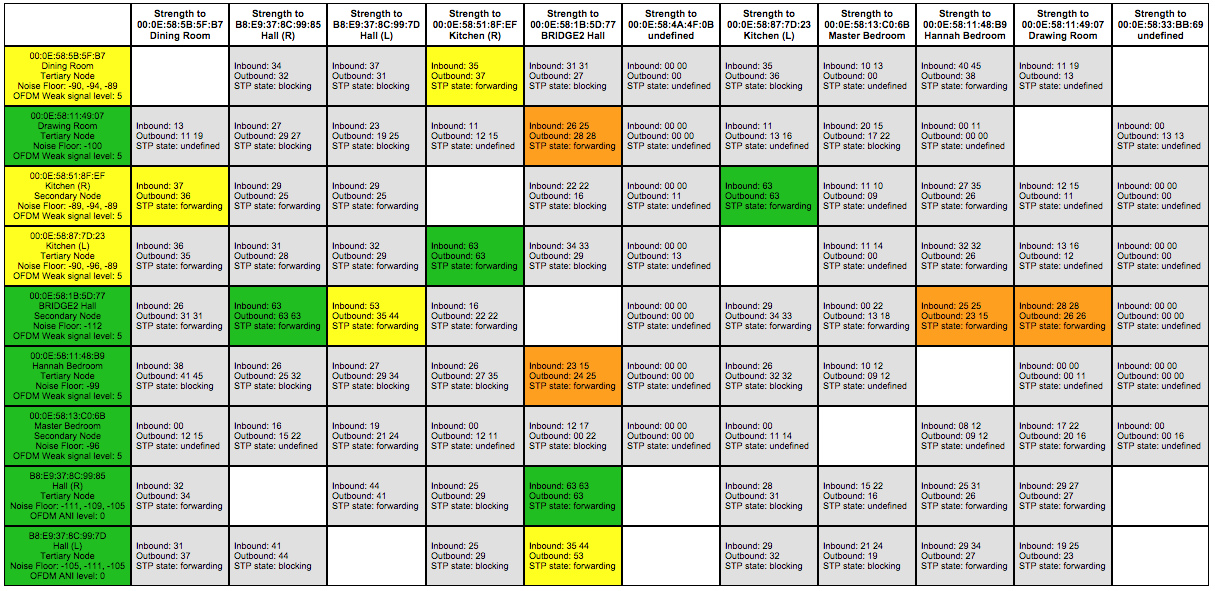
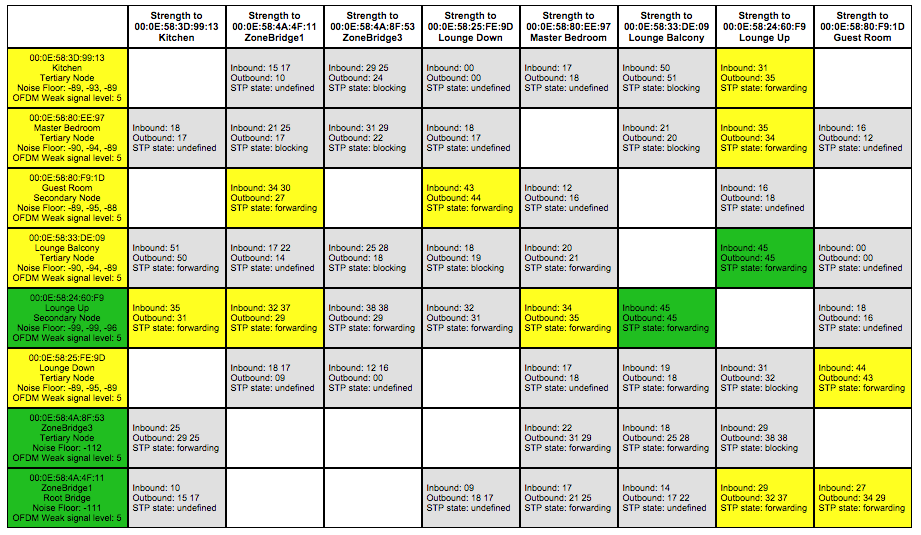
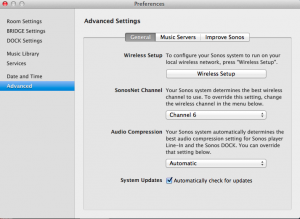 SonosNet is the built-in wireless networking of the Sonos system (although you can also get it to use your own wifi now). SonosNet is effectively a private, hidden wifi network and operates in the same air-space as your own wifi, DECT mobile phones and other wireless devices in the same waveband. For this reason, you should ensure your SonosNet is not on the same channel as your Wifi. It is simple to set this from the desktop controller preferences screen. Choices are Chanel 1, 6 or 11 and your Wifi should also be on one of these three.
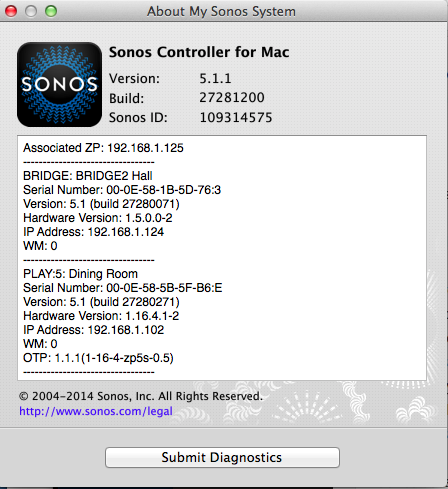
 t is extensible and so any new sensor/actuator/thing you can connect to can be made to work with it. For example it could connect to your Google Calendar to see when you are on holiday, and turn down the heating, or tweet you when the cat comes home.